When it Comes to BI, the Balance Between Data and Visualization is Vital

About This Document
Delve into the best practices in Business Intelligence (BI) with a focus on achieving the essential balance between data collection, analysis, and visualization. This document introduces the “Five Vs” of big data—volume, velocity, variety, veracity, and value—emphasizing the importance of deriving value through insightful data analysis and pattern recognition. It outlines critical steps such as data preparation, exploratory data analysis (EDA), and the utilization of BI tools like PowerBI, Looker, and Tableau to enhance data-driven decision-making. Additionally, it highlights the significance of selecting the right BI tools and partnerships to maximize the effectiveness of BI strategies within organizations.
Full Content Below
Read the Full Document
Explore the complete publication below
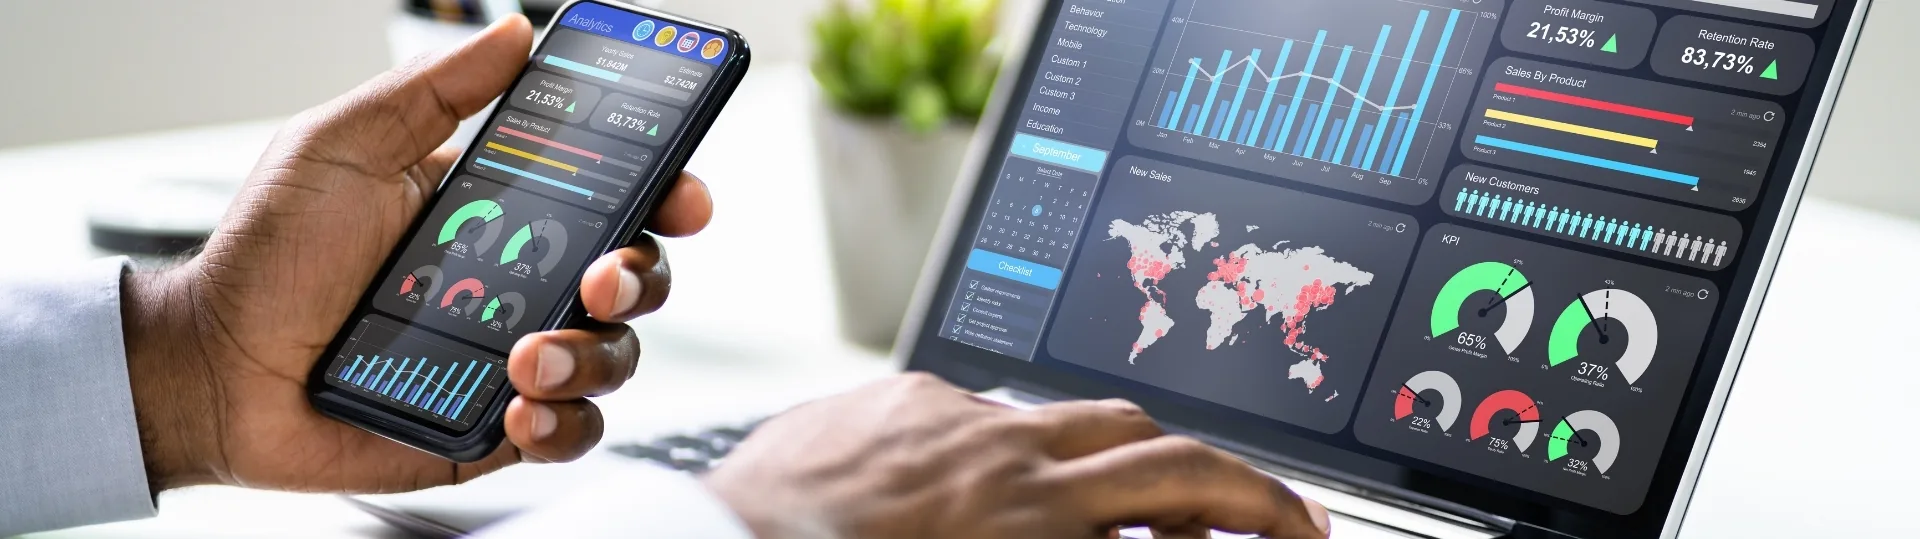
For modern business intelligence (BI) — and specifically data visualization — in order to make better business decisions, the most competent and progressive organizations know the importance of getting the balance right between the information and the imagery. Mastering the art of data visualization is about crafting a narrative that transforms raw data into actionable insights, paving the way for unprecedented business success.
Gartner defines five key capabilities for analytics and business intelligence platforms: automated insights through machine learning, data preparation, data visualization, manageability and product usability. As we will see, a trusted consulting and technology services company like GAP can help provide insight and implementation across all areas.
Beyond Dashboards: Navigating the Five Vs of Successful Data Analytics
The “Five Vs” of big data are well-known: volume, velocity, variety, veracity and value. The latter is the most important; this is where the functions of business intelligence — insight discovery and pattern recognition — derive. But this last step is not possible without getting a mix of the other four.
Many organizations have known for a long time that their data is (or could be) their secret sauce and competitive advantage, but only to the extent they have collected as much as they can and know what to do with it. The actual results are often a complex, tangled mess.
The first step is to get your data ship-shape and ready to be analyzed. This is where data preparation and data cleaning — the process of ensuring records can be matched — comes in.
- Can you ensure your data produces reliable results?
- Can it combine data from different sources?
- Are there any inconsistencies in the data that need to be resolved?
Many algorithms will simply not accept missing values, and will throw an error if data is incorrect. Maintaining the security and privacy of the data being used is another important component.

The Critical Role of Data Cleaning and Analysis Alignment
Another crucial step is to ensure the data gathered is in the format needed in order to later analyze the data. The upshot is that, for best practice with data cleaning, a data engineer would be able to combine the two: to understand the different algorithms, you could use it to perform whatever task you require with your data.
Once a client’s data is organized, stored and cleaned, the analysis can then begin. An exploratory data analysis (EDA) is performed to understand the main characteristics of data sets, with one of the techniques involving visualization.
Also, you must understand the goals of the data project. Does your end-user want to use dashboards? Do they want to perform AI?
At this juncture, it is useful to understand how BI and AI can intersect. While BI is focused on insight discovery and pattern recognition, it is with the “here and now” of data; use cases such as price optimization and inventory management apply.
The next step is to then apply either advanced statistical methods to assess potential future scenarios — such as sales forecasting — or initiate machine learning and predictive analysis. Many clients who perform BI on their data will get to a mature model in order to perform more AI and ML.

Choosing the Right BI Tool
One of the reasons organizations benefit from the experience and expertise of GAP engineers is through our collective experience of knowing the best way to present an idea or visualize a specific outcome. This can be seen through the various BI tools available, whether it is PowerBI, Looker, Tableau or others.
Don’t make the easy mistake of thinking that if your company already relies heavily on Microsoft’s suite of productivity and collaboration tools — or if you work in a Google-centric organization — then their particular software should necessarily follow. This is an important consideration, but not the only one. For example, Looker from Google is the main BI tool used internally at GAP, in part because having licenses and easy sharing options tipped the balance in that direction.
So before making your selection, conduct a deep analysis of any tool:
- Do you have all the functionalities and charts you would need from a dashboard in that tool?
- Is it intuitive and user-friendly for both technical and non-technical users?
- Does it scale without sacrificing performance?
- What are its integration capabilities?
- Do you have the correct licenses to visualize and write data?
- What’s the total cost of ownership?
- Is it AI-powered?
GAP has advisory services to help you easily evaluate and select the right BI tool that best meets your organization’s needs and drives actionable insights from your data.

GAP’s Expertise Helps Clients Get Better Insights
One GAP client in the market research and analysis business uses data to analyze the effectiveness of campaigns, and has a specific methodology to calculate and analyze information related to markets and consumer preferences.
GAP came in to automate the process of creating reports. When the client sends the information to generate a report, GAP runs the automated process and generates multiple deliverables, from spreadsheets to a Tableau report.
One of the key challenges to overcome was in reducing the time needed to create the reports. An exploratory data analysis (EDA) is performed to ensure the raw data can provide value before charts are created, and dashboards are then drafted and reviewed by the client before being delivered.
This particular client preferred Tableau for its reporting and delivery capabilities, as it provides the flexibility needed to deliver the report. The stack was based around Python, SQL and Tableau, a common trio in providing an end-to-end solution for data analysis. Python is for data science and machine learning, SQL is for the database, and Tableau is for BI and data visualization.
GAP was chosen not only for our knowledge in Python, SQL and Tableau to create the solution, but also for our expertise in the methodology to deliver this project. One aspect with the EDA, which requires experience to navigate, is in understanding value beyond the numbers on the page. Looking at the raw data alone, an inexperienced analyst may not recognise a trend that will appear when the data is in a chart or map. How you perform the analysis of your data is important to be able to get greater insight later.

Leverage Expertise to Maximize Insights
Collaboration with the client is key, as each organization will have its own preferences for how their data is presented. Again, however, experience is key. A good partner will understand there is not a single way of doing things, and that a client’s own expertise in their line of business is an important part of the story they want to tell with their data.
Ultimately, the success of any BI project boils down as much to the data as it does the dashboard. It all goes back to the five Vs. Take volume as an example: if you want to perform an analysis of trends with only 18 months of data collected, you may not identify as much as you would like, but it depends on other factors.
More data often leads to more accurate and insightful analysis. With a larger volume of data, patterns, trends and correlations that might not be apparent in smaller datasets can emerge. This allows organizations to make more informed decisions based on a deeper understanding of their data. And it’s why those who get it wrong find their analytics tools are little more than expensive vanity projects.
By engaging with a technically proficient solutions partner such as GAP, you can avoid falling into this trap.