
Data analytics seems like a simple concept on the surface: take lots and lots of data points, and turn them into actionable insights that optimize profits or business processes — a very popular and valuable service, but one that is also highly complex.
To tackle the inherent complexity of analytics, we find that projects require a healthy undercurrent of…curiosity.
Not what you expected?
It’s true. Each member of our Data Science Services team has a curious, scientific mindset tuned to not only uncover customer-requested insights, but also generate hypotheses, and seek out answers to questions not yet asked. In this article, we take a high-level look at how curiosity plays a pivotal role in analytics, and offer some examples of our recent successes in this field.
Exploratory Phase
At kick-off, as we begin to look at the structure, content and semantics of the datasets, we work to determine how these attributes can be transformed to improve the quality of decisions being made. Our engineers’ training prepares them to understand the technical details of the project, but it’s curiosity that causes them to ask high level questions like:
- Can we summarize and aggregate this data to find our answers?
- Can we classify, redirect or create a new process to improve business decisions?
- How does the semantic meaning of the data relate to its statistical properties (like cultural, geographic, and psychographic context), beyond just the raw values provided in the dataset?
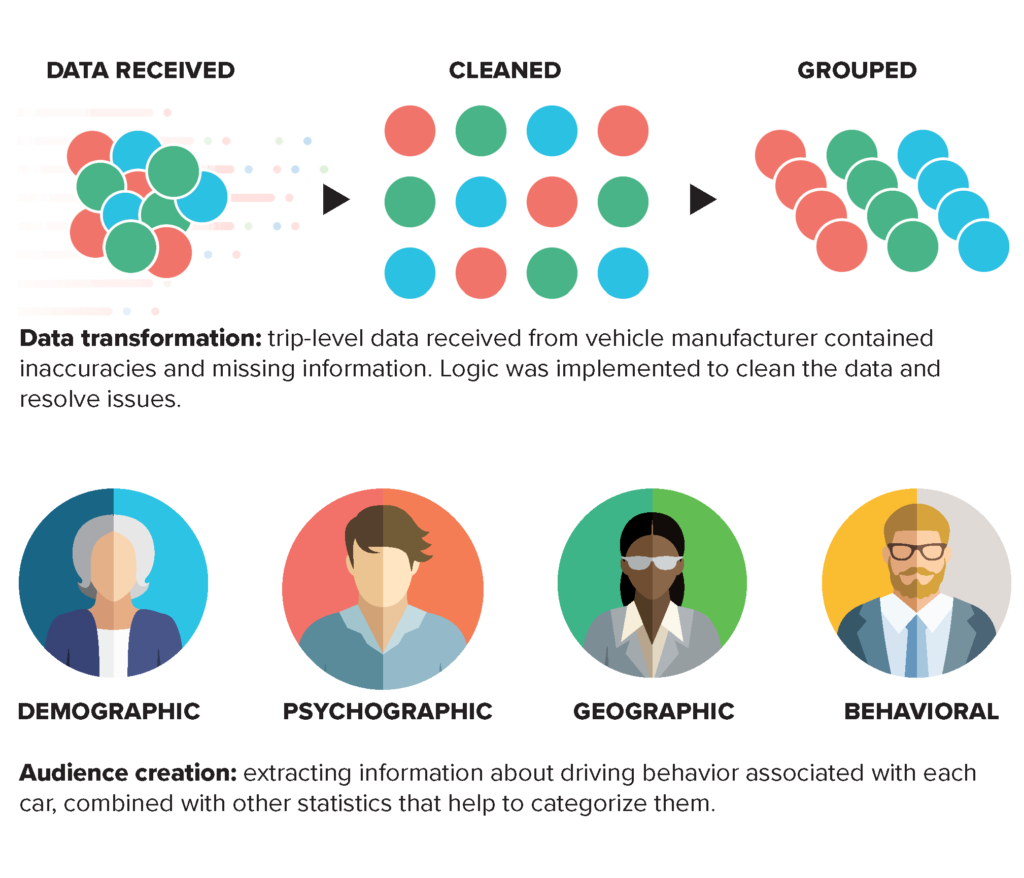
For example: a client wanted to integrate driver information from a major automotive manufacturer into its larger data universe to acquire actionable insights into driver behavior.
GAP cleaned and grouped the data, created audiences compliant with client’s existing data structure, and developed a classification system for drivers that were not initially in the client’s universe database to be included in the audiences being created. The impact was in utilizing cultural touchstones – demographic, psychographic, geographic, and behavioral attributes – to extract information based on related data. The audience creation model generated by GAP expanded the client’s reach and improved targeting for marketing campaigns.
Cleaning Phase
After the exploratory phase, we move into cleaning and parsing the data elements, looking at both content and structure. Remember, in its purest form, no assumptions can be made about the data. Each team member must understand the data – and the errors contained within it – to create the best solution. Here again, it is curiosity that causes us to ask:
- What about the missing data? What do the blanks mean, and do they matter? Can we make educated guesses?
- What statistical anomalies are present? What do these anomalies indicate? How do they impact our project?
- What should we anticipate in the transformation phase?
Transformation Phase
As we finalize our decisions to the above questions during cleaning, we must apply those decisions to the data sources. Some data must be parsed and formatted to be useful. We begin to inquire about the structure and data types.
- If a dataset consisting of rows (like weather readings) has a value that is missing, can we extrapolate it from rows immediately before and after?
- Can we make informed decisions about missing data based on available data?
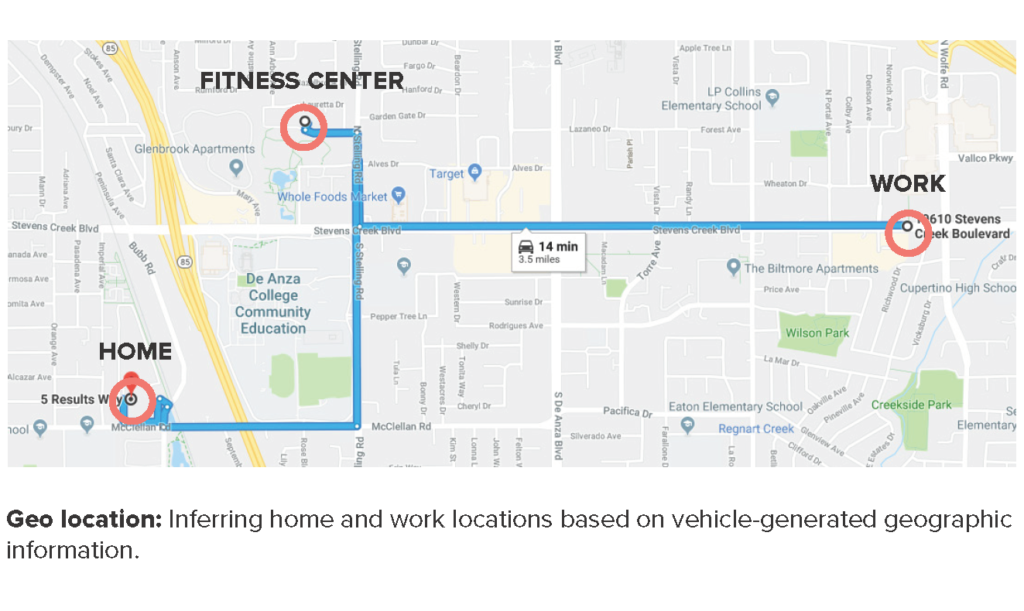
For example: Our client – a major marketing company – desired to create new location and behavior-based attributes for target consumers that could be leveraged in model and audience creation, derived from data provided by a vehicle manufacturer. This data set contained vast amounts of information, but lacked necessary context relating one action to another, making the data hard to parse and interpret for our client’s purposes. GAP developed a new methodology of data creation derived from existing approaches, that allowed us to map a vehicle’s journey using numerous geo-location data points. Before any insights could be extracted from the data, the analytics team had to verify its validity by sifting through it. Algorithms were created to identify drivers’ home and work location by drawing conclusions from the number of visits to a specific location, and amount of time spent at each location during specific intervals. By optimizing existing approaches to extract better results, GAP developed a methodology for the creation of these attributes. This unique model allowed our client to create and place better-targeted ads based on a consumer’s rider journey.
Classification Phase
As the project moves on to model development, training, creation and evaluation, the analytics team will employ machine learning and algorithms to make predictions, using the transformed data as input for the model. In essence, we are letting the machine know how we will test it. This is a complex process, with a variety of tools and delivery methods, and skilled data analytics professionals should ask questions at each step that will optimize results.
- Do we have enough data to make an informed decision to train the model properly?
- Have we validated our hypothesis using critical scientific processes?
- Are our results meeting the business objective?
- What insights have we uncovered that could meet a future need? Improve a process? Increase profitability?
For example: one of our clients purchased census data from Japan, and wanted to integrate it into its larger data universe. Upon acquiring the census data, the client realized that the data set used non-Latin characters, and required contextual understanding of Japan’s administrative operations, in order to match them with existing data tables. Existing translator programs were not effective in translating the data set, so GAP found a one-to-one translation service to perform the translation. After translation, GAP enhanced and standardized the data to be used in modeling efforts for audience creation. The client was presented with a data set that could be readily used and integrated with their larger data universe. As an added bonus, GAP created a tool that can be used to update all data models faster, improving the overall process for regular data refresh.
Throughout an analytics project, there are four elements that influence our curiosity.
- The Work: In data analytics, 90 percent of the work comes before the model. The transformation is the heavy lift required to make accurate classifications and predictions. If you fail here, you will not get your expected results.
- The Models: Once the data table has been set, one can apply the appropriate model(s) based on project goals and desired outcomes. There are often new discoveries and insights gleaned as a result of applying these models to a clean dataset.
- The Communication: The project team must talk with the project owners, domain experts, business analysts and similar groups without going through the organizational hierarchy, because many decisions are contextually sensitive. There is no way for the team to understand all the variables that impact the business, and with restricted communication, the team could miss a big piece of the puzzle.
- The Visuals: Visualization is a pivotal part of the process. A scatter plot will show where correlations occur, and it provides a significant clue about the relationship and distribution between variables. For example:
- If we have plot variables, do the outliers matter? How will they affect the quality of our results?
- How will the inter-dependencies of the data affect the business objective?
We operate at the intersection of Software Development and Data Science
In today’s data world, creating a new, clearly defined and verified algorithm is becoming increasingly rare; however, creative, inquisitive and curious teams can offer up methods of manipulating data that have previously been unexplored, or were thought to be impossible. By building purposefully diverse teams, GAP provides our clients with context-sensitive methodology improvements that result in significant process optimization and automation contributions, to assist in deriving decisions and outcomes from the data sets. We’ve obtained better results through research-derived cultural insights, and by following best practices to avoid bias in a consistent way, both a direct result of diversity of thought and expertise that’s hard-coded into our teams.
Analytics projects are typically carried out by data scientists – highly competent technical professionals, who nevertheless do not possess the expertise of a software engineer. In cases of the above-described projects, the performance, efficiency, and accuracy of the resulting software function was improved exponentially by inclusion of software engineering in the development process. In many cases, improvement was measured to be 10 to 50 times over original expectation. Our analytics teams are configured differently than most, tuned to deliver the best results possible through constant application of intellectual rigor, cross-pollinating inquiry, and a healthy dose of good old-fashioned curiosity. This multi-disciplinary collaboration is what makes GAP different, and consistently yields results surpassing client expectations.
Conclusion
Together, GAP’s data engineers and data scientists are masters of their technical craft, but they also approach data analytics as a creative endeavor. A multi-disciplinary team practicing applied curiosity can provide a fresh perspective, helping you audit, leverage and interpret your data differently, and ask questions that can have a transformative effect on your business. We encourage you to nurture curiosity within your own project teams, it may very well produce results that far exceed your expectation.
At Growth Acceleration Partners, we have extensive expertise in many verticals. We can provide your organization with resources in the following areas:
- Software development for cloud and mobile applications
- Data analytics and data science
- Information systems
- Machine learning and artificial intelligence
- Predictive modeling
- QA Automation
If you have any further questions regarding our services, please reach out to us.
About Sergio Morales Esquivel

Sergio Morales Esquivel is the Global Analytics Technology Strategist at Growth Acceleration Partners, and a professor at the analytics post-graduate program at Cenfotec University. Sergio leads the Data Analytics Center of Excellence at GAP, where he directs efforts to design and implement solutions to complex data-related problems. Sergio holds a B.S. in Computer Engineering, and an M.S. in Computer Science from Tecnológico de Costa Rica. Outside of work, he enjoys traveling, making games and spreading the love for open software and hardware. You can connect with Sergio on his website or LinkedIn, or send him an email.