
You can’t avoid it; big data and analytics tools are everywhere and companies are adopting data mining and leveraging analytics tools to maintain a competitive advantage. The big data landscape can be vast, and before organizations make the plunge, it pays to be able to separate marketing hype from reality. In this post, we discuss how big data and analytics tools can help your organization.
What do we mean by big data and analytics tools?
In some of our other blog posts, we’ve already covered big data. So what are analytics tools and how can they help your organization?
Analytics tools are basically software products; they help businesses run predictive and prescriptive models on scalable frameworks and NoSQL databases which often contain vast quantities of unstructured data whether it be social media posts, traffic data or weather data. Analytics tools allow businesses to rapidly mine big data content more quickly than traditional methods.
If you search around on Google, you’ll find a list of many vendors (such as Amazon and Microsoft) with tools and platforms, a lot of them share some common characteristics and algorithms such as:
- Classification
- Clustering
- Data Mining
- Deep Learning
- Machine Learning
- Neural networks
- Similarity and correlation
- Visualization
[bctt tweet=”Companies are adopting #datamining and leveraging #analytics tools to maintain a competitive advantage” username=”GAPapps”]
How can the tooling help my business?
So, with these common characteristics in mind, how can these help your business make better-informed decisions or provide you with insights into your existing data? We can explore some of these.
Classification
If your organization deals with vast amounts of text, a process called Classification can be employed. Classification is a technique that involves organizing data into predefined classes based on specific attributes. There are many implementations such as Naïve Bayes and NTLK.
When classification is coupled with machine learning and human-supplied training data, the machine can automatically determine which category of incoming emails or documents should belong to thereby removing the need for human effort. Classification is often used in email spam filters for applications for email clients such as Microsoft Outlook.
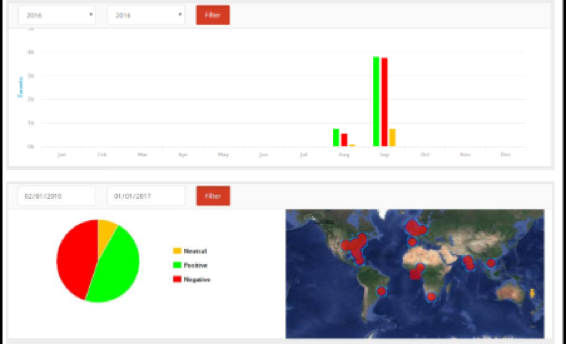
Microsoft offers a Text Analytics API (in beta at the time of writing) that allows you to classify streams of text into either positive or negative emotion. Other SaaS platforms such as Social Opinion offer similar functionality and apply text classification to social media data posts to determine how people feel about a product, brand or service.
Clustering and Segments
This involves dividing up your larger datasets into collections of smaller groups that display similarities. For example, on social media platforms such as Twitter and Facebook, businesses can target very specific users of the respective platforms by applying clustering and segmentation techniques. Ideal for marketing. Or for example, tools such as Google Analytics allow you to segment website visitors based on specific attributes.
Visualization
As the name suggests, with such vast datasets it can be hard to see the woods for the trees. Most analytics tools provide numerous ways to visualize your data in several rich and immediately easy-to-understand formats.
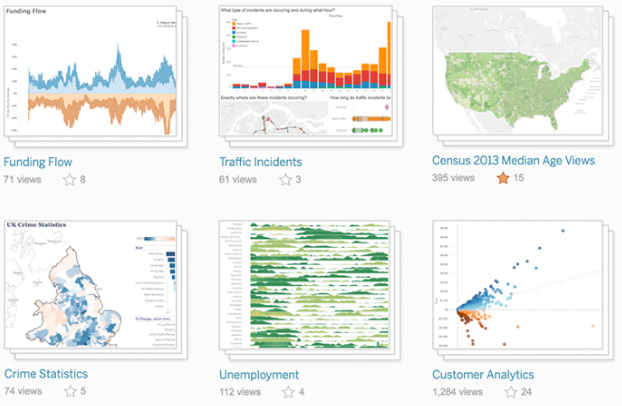
Tableau is a popular product that allows you manipulate big data in an easy to use manner and is dedicated to organizations that work with big data. You don’t even need to be a developer to use it. You can connect your data from a simple spreadsheet or a complex Hadoop database and build rich easy-to-understand charts or dashboards.
Microsoft’s Power BI is another product that allows you to visualize your data in new ways. With just a few mouse clicks, you can integrate it with data sources such as Google Analytics to produce rich visual insights as to how website visitors are behaving.
Predictive Analytics
This is a branch of data mining that helps predict probabilities and trends. It generally involves gathering historical datasets from several sources which is then used to arrive at future predictions and trends.
Companies collect gigabytes of data on customers; what they’ve purchased, when they’ve made the purchase, the quantity, how long a customer has remained on a product page, or even who they interact with on social media.
It all seems unconnected but if this information is mined correctly, these seemingly unconnected data sets can be used to predict the types of products or services potential customers might be interested in, and more importantly, over the correct digital channel.
Companies like Amazon and Netflix have mastered this art. Amazon suggests “books you might also be interested in”, Netflix offer a similar feature on their streaming platform. Features like this are often surprisingly accurate and it’s all made possible due to big data and predictive analytics.
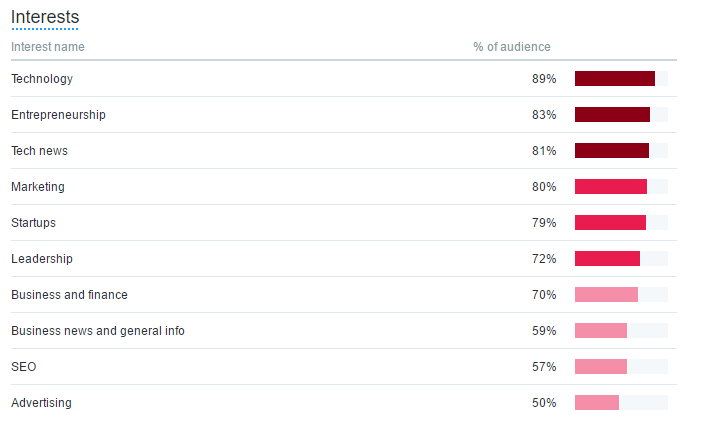
Source: Twitter Ads
As a business owner, predictive analytics can help you arrive at credit scoring to determine debtor risks, customer likes or dislikes to determine which of your products to promote.
[bctt tweet=”How Can #BigData and #Analytics Help Your Organization ” username=”GAPapps”]
Facebook and Twitter contain vast amounts of data on the users of the respective platforms. By using the Facebook or Twitter Advertising APIs, it’s possible to extract audiences for hyper-targeted advertisements base on attributes such as lifestyle, consumer behavior and much more.
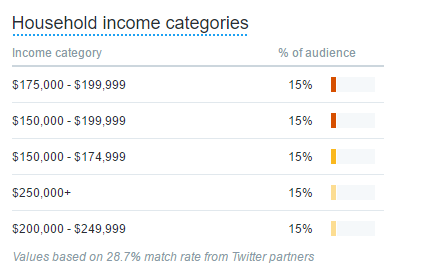
Source: Twitter Ads
Who can use these tools?
Historically, these types of tools and algorithms were reserved for statisticians, mathematical professors, and PhD types, but in recent years there has been an explosion in “cognitive computing” which has saw the commoditization of complex algorithms and analytics tools that can be used “off the shelf”.
This has consequently resulted in businesses embedding these big data and analytics tools deep into their existing business processes and products. Big data and analytics tools are used by the following (but not limited to):
- Data scientists
- Software engineers
- Business analysts
- Project manager
- C-Suite executives
Whilst all roles would generally work together throughout the software development lifecycle, the data scientist could have a massive impact in terms of the features the new software product should have or domain problems that business analysts should be focussing on.
Think about it for a minute. Traditionally, analysts would speak to subject matter experts in the problem domain and produce functional specs based on current business problems. There may be discrepancies between requirements users communicate to analysts against what the raw data says.
The data scientist could manipulate existing data sets from several sources and identify patterns in systems and/or inefficiencies which might be of interest to the business analyst.
The business analyst could document these and produce a functional specification around these findings. This could then be presented this to the user community and project manager to illustrate how a newer process or software solution can address inefficiencies and improve their business.
Summary
In this article, we’ve explored how big data and analytics tools can help your organization. As is often the case, and especially when working with big data, there is no silver bullet. You must use the right resources and products for the job at hand.
Here at Growth Acceleration Partners (GAP), our specialized team of data scientists and engineers use analytics products and frameworks such as R, Python, Apache Spark, H20.ai, KNIME, SAS or MATLAB to help businesses “find signals in the noise” which translates into making better-informed decisions.
We can help you navigate the big data landscape using our team of data scientists, engineers, and analytics experts. Whether you’re looking to undertake an ETL project or visualize existing datasets, GAP can meet your requirements. Contact our sales team here.