
When working with Big Data and undertaking analytics activities it can be hard to get a handle on the data you’re working with. Fortunately, there are many analytics tools that can make this task easier to manage, tools that can help you visualize your data more easily as well as merge multiple datasets from disparate sources.
In this blog post, we explore some of these tools that can help your business. Whether you’re a data scientist, developer or statistician, we’re sure you’ll find this blog post interesting!
Analytics tools for Storing Big Data
When dealing with big data, you’re often dealing with multiple data sets and sometimes even different data structures at scale. Having a database that can handle such characteristics is important. MongoDB and Microsoft Azure Table Storage are two NoSQL database products that can help you with such challenges.
MongoDB
Initially released in 2009, MongoDB has built a massive following in the developer community, especially through increased adoption of NoSQL data models. MongoDB is a document-oriented database, that has a slightly more complex storage model that Azure Table Storage. One of the main reasons for this is because MongoDB often isn’t provided as a SaaS offering but rather is delivered as a distributed system that you host.
A database in MongoDB consists of Collections (you can consider these to be tables) whereby a Collection stores BSON Documents. BSON Documents are like JSON and have a binary encoding, each Document contains Fields that consist of a key/value pair where the values are basic types such as strings, integers and floats (akin to Azure Table Storage Properties).
Azure Table Storage
Azure Table Storage has been around since about 2008 and has consistently been improved by Microsoft ever since. It uses the concept of a Storage Account which defines a key/attribute style and supports schema-less tables. Each table within the model can contain Entities which in turn have variable sets of Properties (bool, binary, string, double and so on) which gives you a solid foundation in which you can query Azure Table Storage using SDKs that let you access the platform using languages such as .NET, Java, PHP, Node.js and REST clients.
From a developer’s perspective, both products are great to work with and offer support for multiple languages. MongoDB does offer official support for more languages than Azure Document DB, however. Both databases can run at scale so you don’t need to be too concerned on that aspect.
[bctt tweet=”When working with Big Data and undertaking analytics activities it can be hard to get a handle on the data you’re working with. Fortunately, there are many tools that can make this task easier to manage.” username=”GAPapps”]
Analytics tools for Visualization
Based out of Seattle, Washington, Tableau is software that specializes in building top quality data visualization products. In recent years, we have seen a demand for experts in Tableau, especially in BI and Finance. Tableau is helping to democratize big data reporting and analytics to the end user. It is generally offered as a SaaS platform that can run on either the Desktop, Server or even Online as a Cloud Application. Unlike other BI products, Tableau makes it easy for users to work with on a day to day basis.
If you opt for the Desktop offering, you simply download and install the tool, connect your data sources and can start building complex reports with minimal technical assistance.
If you have basic Office skills, (Excel for example), you’ll find getting to grips with Tableau relatively easy. With a drag and drop interface and support for large datasets, Tableau and its rich visualizations can help you get a handle on your most complex information.
Data Wrapper
Just like Tableau, you don’t need to be a developer to use rich visualizations with Data Wrapper. You simply upload your datasets then let Data Wrapper do the rest. The product was built by journalists and is used around the world in newsrooms such as the New York Times, Bloomberg and many more.
It has various price plans and at the time of writing is more economical than Tableau. With firms such as Twitter and Buzzfeed making use of Data Wrapper, you can be assured it’s more than capable of handling any dataset you throw at it.
Developer Tools
As a developer, you often find yourself writing code that must query and select information from relational or NoSQL databases to then display this information in web, mobile or even desktop applications.
Working with datasets and rendering complex information formerly was a time-consuming task. However, with the advent of powerful client-side libraries, developers can easily build dashboards that render big data to end users.
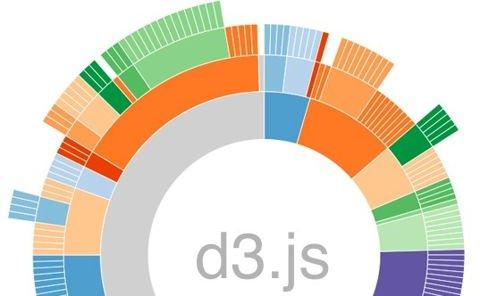
Data-Driven Document (D3.JS)
D3.JS is a JavaScript library that can render graphics in HTML5, CSS and SVG. The library can support real-time datasets and offers various animations and interactions. From a developer’s perspective, the plug-in and out the box components make the library a pleasure to use and you can be up and running quickly.
One note worth pointing out is that D3 makes it much easier to manipulate the DOM in an HTML document. Consider you wanted to change the text color of all P tags in a piece of HTML. Using the DOM W3C DOM API, you’d have something like this:
var paragraphs = document.getElementsByTagName(“p”);
for (var i = 0; i < paragraphs.length; i++) {
var paragraph = paragraphs.item(i);
paragraph.style.setProperty(“color”, “white”, null);
}
With D3, this simply becomes!
d3.selectAll(“p”).style(“color”, “white”);
Highcharts
Highcharts is another client-side library and is also mobile friendly. It works well with jQuery and lets you render a whole range of simple charts such as bar charts, pie charts and real-time line graphs. One neat feature of Highcharts is that a high chart can be completely defined as a JSON object which means as a developer, you can design your objects and code to return JSON which simply gets used by the Highcharts API.
It features a consistent API amongst most of the charts, for example, if you wanted to change your pie chart to a bar chart, you can do this by changing just one setting like this:
configobj.chart.type=’bar’;
One way to think of both these libraries is the following. If you want to build a new chart that no-one has ever seen before, with lots of customization, D3 could be the better option. Alternatively, if you just need to create regular charts more quickly, then Highcharts is more than capable of this!
[bctt tweet=”Tableau is software that specializes in building top quality data visualization products. Tableau is helping to democratize big data reporting and analytics to the end user. ” username=”GAPapps”]
Summary
In this blog post, we’ve explored some of the tools that can help you work with big data as well as looked at some that can make your data analysis tasks easier to perform. Why not try some of these out? They could make your job a bit easier or help you unearth further insights into your data.
Here at Growth Acceleration Partners, we have extensive expertise in many verticals. Our nearshore business model can keep costs down whilst maintaining the same level of quality and professionalism you’d experience from a domestic team.
Our Centers for Engineering Excellence in Latin America focus on combining business acumen with development expertise to help your business. We can provide your organization with resources in the following areas:
- Software development for cloud and mobile applications
- Data analytics and data science
- Information systems
- Machine learning and artificial intelligence
- Predictive modeling
- QA and QA Automation
If you’d like to find out more, then visit our website here. Or if you’d prefer, why not arrange a call with us?